
math
statistics
This year, we learned about statistics. During this lesson, we had a project where we had to make a survey. My survey questioned people about "how many ours per week do you practice a sport?" I got 43 responses, so after I gathered the data, I made a slide show telling the mean, median, mode, range, and a couple of graphs of my data.
I chose this project because I thought that it was kinda fun to create the survey and the graphs showing the data. I also chose this project because it shows that I can use online resources to create graphs.
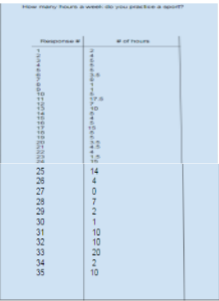
This is a table of the data that I collected.
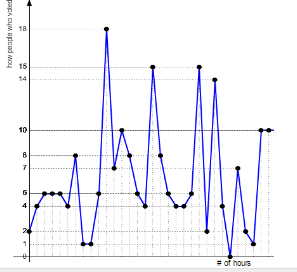
This is a type of graph called a line graph and it is showing all data I collected.

This is a type of graph called a bar graph and it is showing all data I collected.